DeworkHub|基于凯利公式的 BTC/USDT 量化交易策略
凯利公式(Kelly Criterion)是由约翰·凯利(John Kelly)在 1956 年提出的一种资金管理方法,旨在最大化长期资金增长率。其核心思想是根据胜率和赔率动态调整每次投资的仓位。
凯利公式的数学表达式为:
f^{*}=\frac{bp-q}{b}
其中:
-
f^{*} :最优投资比例(仓位比例)
-
b :赔率(盈利金额与亏损金额的比值)
-
p :胜率(盈利概率)
-
q :败率(亏损概率), q=1-p
废话不多说,上代码:
import ccxt
import pandas as pd
import numpy as np
import matplotlib.pyplot as plt
import matplotlib.dates as mdates
from datetime import datetime, timedelta

# 初始化 OKX 交易所
exchange = ccxt.okx()

# 设置参数
symbol = 'BTC/USDT'  # 交易对
initial_balance = 10000  # 初始资金 10,000 USDT
taker_fee = 0.0006  # 吃单费率 0.06%
maker_fee = 0.0002  # 挂单费率 0.02%
slippage = 0.0005  # 滑点 0.05%
stop_loss = 0.05  # 止损比例 5%
take_profit = 0.10  # 止盈比例 10%

# 获取过去一整年的 1 小时线数据
def fetch_ohlcv(symbol, timeframe='1h', days=365):
    since = exchange.parse8601((datetime.utcnow() - timedelta(days=days)).strftime('%Y-%m-%d %H:%M:%S'))
    ohlcv = []
    while True:
        data = exchange.fetch_ohlcv(symbol, timeframe=timeframe, since=since)
        if not data:
            break
        since = data[-1][0] + 1  # 下一批数据的起始时间
        ohlcv.extend(data)
        if len(data) < 100:  # 如果数据不足 100 条,说明已经获取完所有数据
            break
    df = pd.DataFrame(ohlcv, columns=['timestamp', 'open', 'high', 'low', 'close', 'volume'])
    df['timestamp'] = pd.to_datetime(df['timestamp'], unit='ms')
    return df

# 计算收益率
def calculate_returns(df):
    df['return'] = df['close'].pct_change()
    return df

# 计算胜率和赔率
def calculate_kelly_params(df):
    wins = df[df['return'] > 0]['return']
    losses = df[df['return'] < 0]['return']
    p = len(wins) / len(df)  # 胜率
    b = wins.mean() / abs(losses.mean())  # 赔率
    return p, b

# 凯利公式计算最优仓位
def kelly_criterion(p, b):
    return (b * p - (1 - p)) / b

# 策略逻辑
def run_strategy(symbol):
    df = fetch_ohlcv(symbol, timeframe='1h', days=365)  # 获取过去一整年的 1 小时线数据
    df = calculate_returns(df)
    p, b = calculate_kelly_params(df)
    f_star = kelly_criterion(p, b)  # 最优仓位比例

    balance = initial_balance
    asset_values = []  # 存储资产价值
    positions = []  # 存储仓位状态

    for i in range(1, len(df)):
        current_price = df['close'].iloc[i]
        return_rate = df['return'].iloc[i]

        # 动态调整仓位
        if i % 24 == 0:  # 每天重新计算一次仓位
            p, b = calculate_kelly_params(df.iloc[:i])
            f_star = kelly_criterion(p, b)

        # 计算仓位
        position_size = balance * f_star  # 根据凯利公式计算仓位

        # 模拟交易
        if return_rate > 0:  # 盈利
            pnl = position_size * return_rate * (1 - taker_fee - slippage)
        else:  # 亏损
            pnl = position_size * return_rate * (1 - taker_fee - slippage)

        # 止损和止盈
        if pnl < -balance * stop_loss:
            pnl = -balance * stop_loss
        elif pnl > balance * take_profit:
            pnl = balance * take_profit

        # 更新资金
        balance += pnl
        asset_values.append(balance)

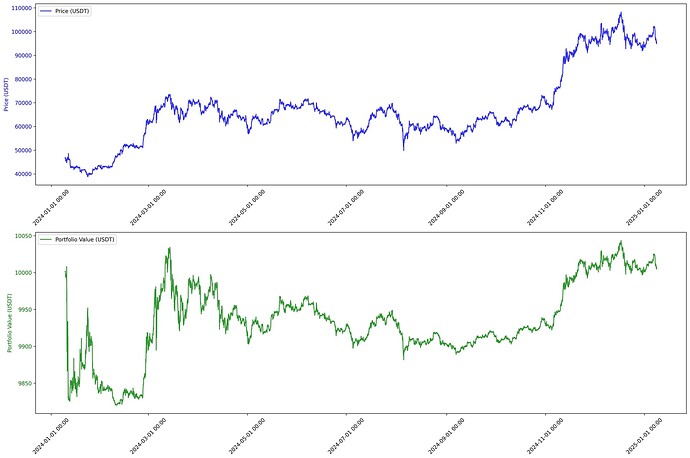
    # 创建图表
    plt.figure(figsize=(18, 12))

    # 子图 1: 价格走势
    ax1 = plt.subplot(2, 1, 1)
    ax1.plot(df['timestamp'], df['close'], label='Price (USDT)', color='blue', alpha=0.8)
    ax1.set_ylabel('Price (USDT)', color='blue')
    ax1.tick_params(axis='y', labelcolor='blue')
    ax1.legend(loc='upper left')

    # 子图 2: 资产价值
    ax2 = plt.subplot(2, 1, 2)
    ax2.plot(df['timestamp'][1:], asset_values, label='Portfolio Value (USDT)', color='green', alpha=0.8)
    ax2.set_ylabel('Portfolio Value (USDT)', color='green')
    ax2.tick_params(axis='y', labelcolor='green')
    ax2.legend(loc='upper left')

    # 格式化日期
    for ax in [ax1, ax2]:
        ax.xaxis.set_major_formatter(mdates.DateFormatter('%Y-%m-%d %H:%M'))
        plt.setp(ax.xaxis.get_majorticklabels(), rotation=45)

    # 保存高分辨率图片
    plt.tight_layout()
    plt.savefig(f'{symbol.replace("/", "_")}_kelly_strategy.jpg', dpi=300, bbox_inches='tight')
    print(f"Chart saved as {symbol.replace('/', '_')}_kelly_strategy.jpg")
    plt.show()

# 运行策略
run_strategy(symbol)
可见凯利公式在投资过程中,稳中求进,是一种获取长期稳定回报的不错选择。

