丢个监控exporter文件

丢个exporter文件,具体怎么用自己琢磨吧。
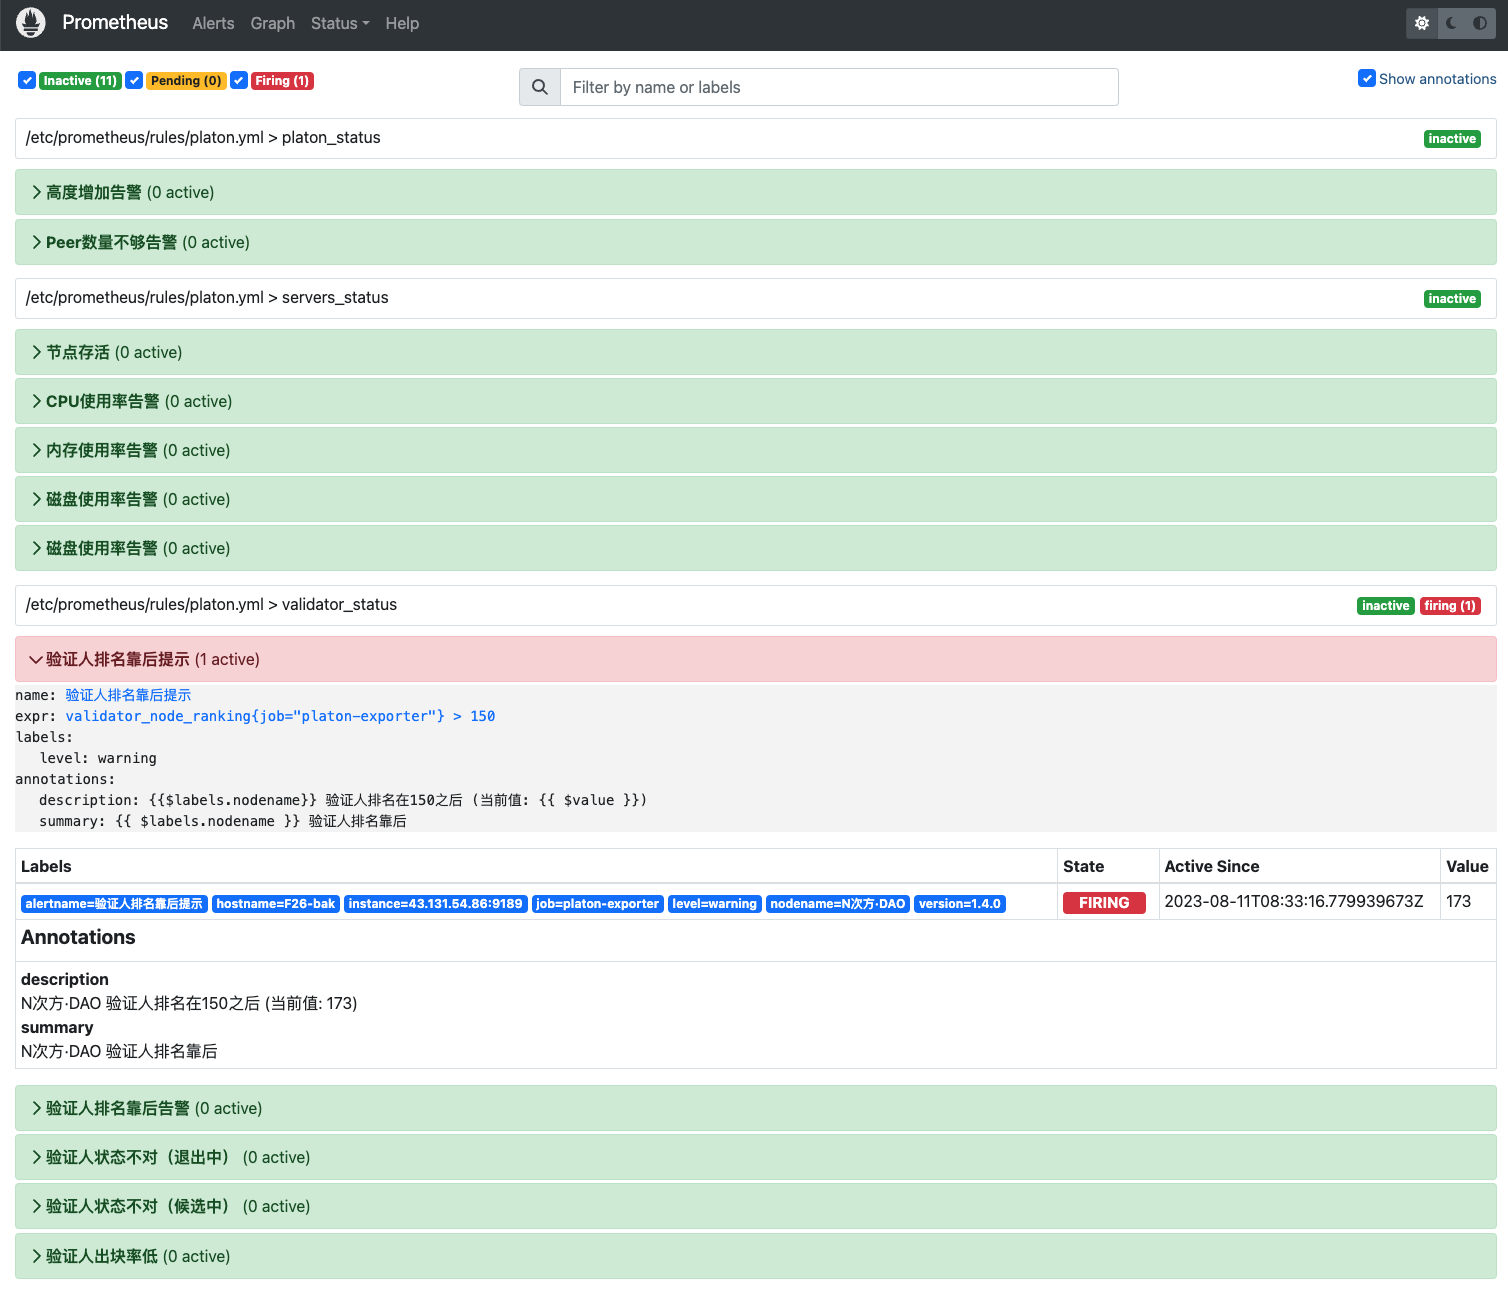
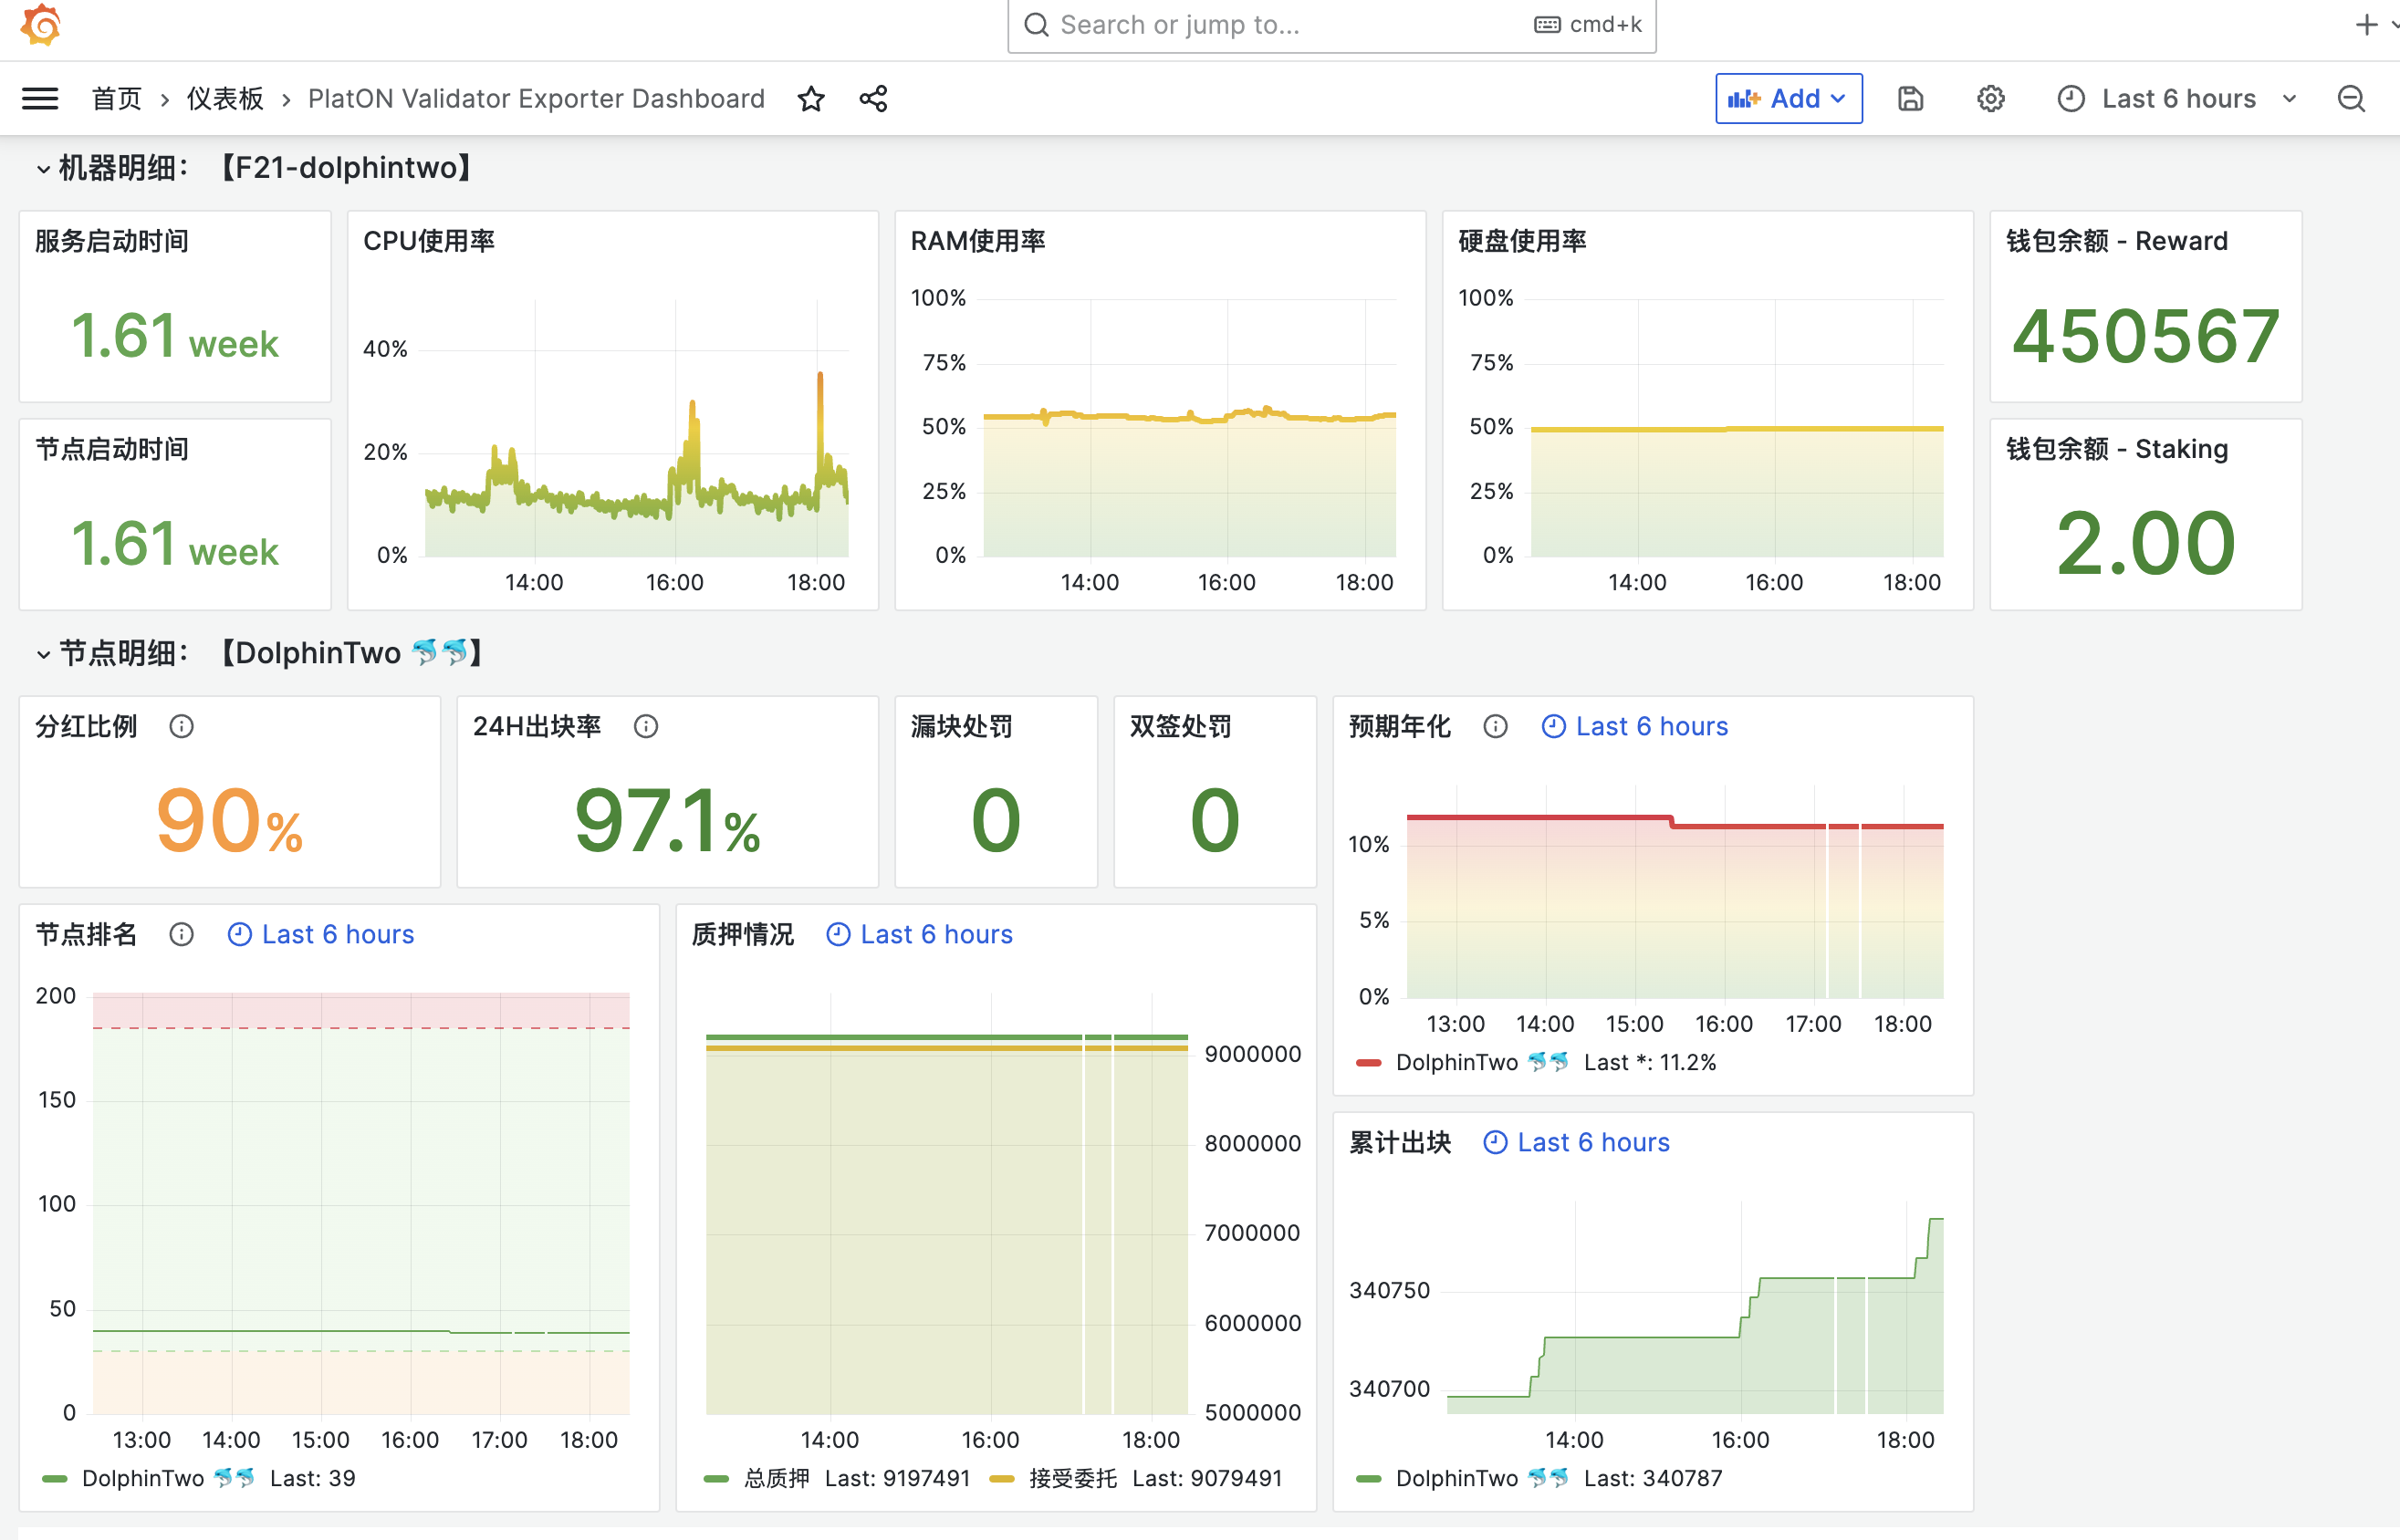
数据示例:

开放代码供大家使用

#!/usr/bin/env python3
# -*- coding: UTF-8 -*-
'''
@Author  :dolphintwo
@Date    :2023/6/13 18:18 
@requirements:
pip install --no-cache-dir prometheus-client PyYAML requests web3 psutil
'''

import logging
import time
import os
import psutil
import sys
import requests
import traceback
from web3 import Web3, HTTPProvider
import prometheus_client
from prometheus_client import start_http_server
from prometheus_client.core import REGISTRY, GaugeMetricFamily

prometheus_client.REGISTRY.unregister(prometheus_client.GC_COLLECTOR)
prometheus_client.REGISTRY.unregister(prometheus_client.PLATFORM_COLLECTOR)
prometheus_client.REGISTRY.unregister(prometheus_client.PROCESS_COLLECTOR)

LOG_FORMAT = "%(asctime)s [%(levelname)s] %(message)s"
DATE_FORMAT = "%Y/%m/%d %H:%M:%S"
LOG_LEVEL = "INFO"

log = logging.getLogger(__name__)
logging.basicConfig(stream=sys.stdout, level=os.environ.get(
    "LOGLEVEL", LOG_LEVEL), format=LOG_FORMAT, datefmt=DATE_FORMAT)

# requests参数
connect_timeout = 10
read_timeout = 10
headers = {'content-type': "application/json"}
body = {"pageNo": 1, "pageSize": 300, "key": "", "queryStatus": "all"} # 分页设置
url = 'https://scan.platon.network/browser-server/staking/aliveStakingList' # 获取浏览器数据


def _settings():
    global settings

    settings = {
        'platon_exporter': {
            'interval': 60,
            # 'platon_rpc': "https://openapi2.platon.network/rpc", # 本地调试使用
            'platon_rpc': "http://127.0.0.1:6789",
            'enable_accounts': 'off', # 检测余额用
            'additional_accounts_list': [ # 格式为HEX地址+账户昵称,建议按照以下格式
                ["0x123", "staking"],
                ["0x456", "reward"],
            ],
            'enable_nodes': 'off', # 监测节点信息用,多节点监测建议只在一台机器上集中监测,格式为nodeid数组
            'nodeid': [
                "0x563bee2d84e015aa3a714fc7ba48d479b43e9eb8981eaef3288c973e6eb16444f836449aab6119544ced42b544679a47ad4d7a8757927da849b809c452382817",
            ],
            'listen_port': 9189,
        },
    }


def _scanrequest():
    '''
    获取浏览器数据
    '''
    try:
        result = requests.post(url, json=body, headers=headers, timeout=(
            connect_timeout, read_timeout))

        if result.status_code == 200:
            result = result.json()
            return result

        else:
            logging.warning('status_code:{},msg:{}'.format(
                result.status_code, result.text))
            return 0

    except Exception:
        logging.warning(traceback.format_exc())
        return 0


def _scannodesinfo():
    '''
    获取节点信息
    '''
    result = _scanrequest()

    if result:
        validators_info = result['data']
        mynodes = (
            validator for validator in validators_info if validator['nodeId'] in settings['platon_exporter']['nodeid'])
        return mynodes

    else:
        logging.warning('Can not get scan_nodesinfo.')
        return 0


def find_procs_by_name(name):
    '''
    获取进程信息
    '''
    ls = []
    for p in psutil.process_iter(["name", "exe", "cmdline"]):
        if name == p.info['name'] or \
                p.info['exe'] and os.path.basename(p.info['exe']) == name or \
                p.info['cmdline'] and p.info['cmdline'][0] == name:
            ls.append(p)
    return ls


class PlatonCollector:
    def collect(self):
        metrics = {
            'platon_current_block': GaugeMetricFamily('platon_block_number', 'The number of the most recent block', labels=['hostname']),
            'platon_gas_price_wei': GaugeMetricFamily('platon_gas_price_wei', 'The current gas price in Wei', labels=['hostname']),
            'platon_syncing': GaugeMetricFamily('platon_syncing', 'Boolean syncing status', labels=['hostname']),
            'chain_id': GaugeMetricFamily('platon_chain_id', 'The currently configured "Chain Id"', labels=['hostname']),

            'boot_time': GaugeMetricFamily('node_boot_time', 'System Boot time.', labels=['hostname']),
            'service_time': GaugeMetricFamily('node_service_time', 'Service Start time.', labels=['hostname']),
            'cpu_usage': GaugeMetricFamily('node_cpu_usage', 'System CPU usage in percent.', labels=['hostname']),
            'ram_usage': GaugeMetricFamily('node_ram_usage', 'System RAM usage in percent.', labels=['hostname']),
            'disk_usage': GaugeMetricFamily('node_disk_usage', 'System RAM usage in percent.', labels=['hostname']),

            # 节点排名
            'validator_node_ranking': GaugeMetricFamily('validator_node_ranking', 'Validator Node Rank.', labels=['hostname', 'nodename', 'version']),
            # 1候选2活跃3出块4在退5已退6共识
            'validator_node_status': GaugeMetricFamily('validator_node_status', 'Validator Node Status.', labels=['hostname', 'nodename', 'version']),
            # 总质押
            'validator_node_totalvalue': GaugeMetricFamily('validator_node_totalvalue', 'Validator Node Total Stakes (LAT).', labels=['hostname', 'nodename', 'version']),
            # 接受质押
            'validator_node_delegatevalue': GaugeMetricFamily('validator_node_delegatevalue', 'Validator Node Delegations (LAT)', labels=['hostname', 'nodename', 'version']),
            # 当前委托者数
            'validator_node_delegateqty': GaugeMetricFamily('validator_node_delegateqty', 'Validator Node Delegators.', labels=['hostname', 'nodename', 'version']),
            # 低出块处罚
            'validator_node_slashlowqty': GaugeMetricFamily('validator_node_slashlowqty', 'Validator Node low block rate slash.', labels=['hostname', 'nodename', 'version']),
            # 双签处罚
            'validator_node_slashmultiqty': GaugeMetricFamily('validator_node_slashmultiqty', 'Validator Node double signing slashing.', labels=['hostname', 'nodename', 'version']),
            # 累计出块
            'validator_node_blockqty': GaugeMetricFamily('validator_node_blockqty', 'Validator Node Blocks.', labels=['hostname', 'nodename', 'version']),
            # 预计节点年化率
            'validator_node_expectedincome': GaugeMetricFamily('validator_node_expectedincome', 'Validator Node Validator Yield.', labels=['hostname', 'nodename', 'version']),
            # 预计委托年化率
            'validator_node_deleannualizedrate': GaugeMetricFamily('validator_node_deleannualizedrate', 'Validator Node Delegated Yield.', labels=['hostname', 'nodename', 'version']),
            # 委托奖励比例
            'validator_node_delegatedrewardratio': GaugeMetricFamily('validator_node_delegatedrewardratio', 'Validator Node Delegated Reward Ratio.', labels=['hostname', 'nodename', 'version']),
            # 24小时出块率
            'validator_node_genblocksrate': GaugeMetricFamily('validator_node_genblocksrate', 'Validator Node 24H Gen-Blocks Rate.', labels=['hostname', 'nodename', 'version']),
        }

        # metric: service_time
        try:
            p = find_procs_by_name("platon")
            if len(p) == 1:
                createtime = p[0].create_time()
                metrics['service_time'].add_metric(
                    labels=[os.uname().nodename], value=createtime)
        except (
            requests.exceptions.ConnectionError,
            requests.exceptions.ReadTimeout
        ) as e:
            logging.warning(
                "Can't get process. The error received follows.")
            logging.warning(e)
        except ValueError as e:
            logging.warning(
                "Can't get the value for service_time. The error received follows.")
            logging.warning(e)

        # metric: boot_time
        try:
            metrics['boot_time'].add_metric(
                labels=[os.uname().nodename], value=psutil.boot_time())
        except (
            requests.exceptions.ConnectionError,
            requests.exceptions.ReadTimeout
        ) as e:
            logging.warning(
                "Can't get sysinfo. The error received follows.")
            logging.warning(e)
        except ValueError as e:
            logging.warning(
                "Can't get the value for boot_time. The error received follows.")
            logging.warning(e)

        # metric: cpu usage
        try:
            cpu_usage = psutil.cpu_percent()
            metrics['cpu_usage'].add_metric(
                labels=[os.uname().nodename], value=cpu_usage)
        except (
            requests.exceptions.ConnectionError,
            requests.exceptions.ReadTimeout
        ) as e:
            logging.warning(
                "Can't get sysinfo. The error received follows.")
            logging.warning(e)
        except ValueError as e:
            logging.warning(
                "Can't get the value for cpu_usage. The error received follows.")
            logging.warning(e)

        # metric: ram usage
        try:
            metrics['ram_usage'].add_metric(
                labels=[os.uname().nodename], value=psutil.virtual_memory()[2])
        except (
            requests.exceptions.ConnectionError,
            requests.exceptions.ReadTimeout
        ) as e:
            logging.warning(
                "Can't get sysinfo. The error received follows.")
            logging.warning(e)
        except ValueError as e:
            logging.warning(
                "Can't get the value for ram_usage. The error received follows.")
            logging.warning(e)

        # metric: disk usage
        try:
            metrics['disk_usage'].add_metric(
                labels=[os.uname().nodename], value=psutil.disk_usage(os.sep).percent)
        except (
            requests.exceptions.ConnectionError,
            requests.exceptions.ReadTimeout
        ) as e:
            logging.warning(
                "Can't get sysinfo. The error received follows.")
            logging.warning(e)
        except ValueError as e:
            logging.warning(
                "Can't get the value for disk_usage. The error received follows.")
            logging.warning(e)

        if settings['platon_exporter']['enable_nodes'] == 'on':
            mynodes = _scannodesinfo()

            for node in mynodes:

                # metric: validator_node_*
                try:
                    metrics['validator_node_ranking'].add_metric(value=node['ranking'], labels=[
                                                                 os.uname().nodename, node['nodeName'], node['version']])
                    metrics['validator_node_status'].add_metric(value=node['status'], labels=[
                                                                os.uname().nodename, node['nodeName'], node['version']])
                    metrics['validator_node_totalvalue'].add_metric(value=node['totalValue'], labels=[
                                                                    os.uname().nodename, node['nodeName'], node['version']])
                    metrics['validator_node_delegatevalue'].add_metric(value=node['delegateValue'], labels=[
                                                                       os.uname().nodename, node['nodeName'], node['version']])
                    metrics['validator_node_delegateqty'].add_metric(value=node['delegateQty'], labels=[
                                                                     os.uname().nodename, node['nodeName'], node['version']])
                    metrics['validator_node_slashlowqty'].add_metric(value=node['slashLowQty'], labels=[
                                                                     os.uname().nodename, node['nodeName'], node['version']])
                    metrics['validator_node_slashmultiqty'].add_metric(value=node['slashMultiQty'], labels=[
                                                                       os.uname().nodename, node['nodeName'], node['version']])
                    metrics['validator_node_blockqty'].add_metric(value=node['blockQty'], labels=[
                                                                  os.uname().nodename, node['nodeName'], node['version']])
                    metrics['validator_node_expectedincome'].add_metric(value=node['expectedIncome'], labels=[
                                                                        os.uname().nodename, node['nodeName'], node['version']])
                    metrics['validator_node_deleannualizedrate'].add_metric(value=node['deleAnnualizedRate'], labels=[
                                                                            os.uname().nodename, node['nodeName'], node['version']])
                    metrics['validator_node_delegatedrewardratio'].add_metric(value=float(
                        node['delegatedRewardRatio'].strip('%')), labels=[os.uname().nodename, node['nodeName'], node['version']])
                    metrics['validator_node_genblocksrate'].add_metric(value=float(node['genBlocksRate'].strip(
                        '%')), labels=[os.uname().nodename, node['nodeName'], node['version']])

                except (
                    requests.exceptions.ConnectionError,
                    requests.exceptions.ReadTimeout
                ) as e:
                    logging.warning(
                        "Can't connect get validator node info. The error received follows.")
                    logging.warning(e)

        if settings['platon_exporter']['enable_accounts'] == 'on':
            metrics.update({
                'account_balance': GaugeMetricFamily(
                    'platon_account_balance',
                    'Account Balance in PlatON Network.',
                    labels=['currency', 'address', 'account', 'type', 'hostname']
                ),
            })
        web3 = Web3(HTTPProvider(
            endpoint_uri=settings['platon_exporter']['platon_rpc'], request_kwargs={'timeout': 60}))

        if web3:
            if settings['platon_exporter']['enable_accounts'] == 'on':
                for additional_account in settings['platon_exporter']['additional_accounts_list']:

                    # metric: platon_account_balance
                    try:
                        metrics['account_balance'].add_metric(
                            labels=['LAT', additional_account[0], additional_account[1], 'platon', os.uname().nodename],
                            value=web3.from_wei(
                                web3.eth.get_balance(additional_account[0]), 'ether')
                        )
                    except (
                        requests.exceptions.ConnectionError,
                        requests.exceptions.ReadTimeout
                    ) as e:
                        logging.warning(
                            "Can't connect to platon. The error received follows.")
                        logging.warning(e)

            # metric: platon_current_block
            try:
                metrics['platon_current_block'].add_metric(
                    value=web3.eth.block_number, labels=[os.uname().nodename])
            except (
                requests.exceptions.ConnectionError,
                requests.exceptions.ReadTimeout
            ) as e:
                logging.warning(
                    "Can't connect to platon. The error received follows.")
                logging.warning(e)
            except ValueError as e:
                logging.warning(
                    "Can't get the value for platon_current_block. The error received follows.")
                logging.warning(e)

            # metric: platon_gas_price_wei
            try:
                metrics['platon_gas_price_wei'].add_metric(
                    value=web3.eth.gas_price, labels=[os.uname().nodename])
            except (
                requests.exceptions.ConnectionError,
                requests.exceptions.ReadTimeout
            ) as e:
                logging.warning(
                    "Can't connect to platon. The error received follows.")
                logging.warning(e)
            except ValueError as e:
                logging.warning(
                    "Can't get the value for platon_gas_price_wei. The error received follows.")
                logging.warning(e)

            # metric: platon_syncing
            try:
                if web3.eth.syncing:
                    metrics['platon_syncing'].add_metric(
                        value=1, labels=[os.uname().nodename])
                else:
                    metrics['platon_syncing'].add_metric(
                        value=0, labels=[os.uname().nodename])
            except (
                requests.exceptions.ConnectionError,
                requests.exceptions.ReadTimeout
            ) as e:
                logging.warning(
                    "Can't connect to platon. The error received follows.")
                logging.warning(e)
            except ValueError as e:
                logging.warning(
                    "Can't get the value for platon_syncing. The error received follows.")
                logging.warning(e)

            # metric: chain_id
            try:
                metrics['chain_id'].add_metric(
                    value=web3.eth.chain_id, labels=[os.uname().nodename])
            except (
                requests.exceptions.ConnectionError,
                requests.exceptions.ReadTimeout
            ) as e:
                logging.warning(
                    "Can't connect to platon. The error received follows.")
                logging.warning(e)
            except ValueError as e:
                logging.warning(
                    "Can't get the value for platon_current_block. The error received follows.")
                logging.warning(e)

        web3 = None

        for m in metrics.values():
            yield m


def _collect_to_http():
    start_http_server(int(settings['platon_exporter']['listen_port']))
    logging.info('PlatON Exporter running on http://localhost:9189/metrics')
    while True:
        time.sleep(int(1))


if __name__ == '__main__':
    _settings()
    logging.debug('Loaded settings: {}'.format(settings))
    REGISTRY.register(PlatonCollector())
    _collect_to_http()

赶紧拉盘吧,实在无聊。

3 个赞

还有这个

# /etc/systemd/system/platon_exporter.service;
[Unit]
Description=PlatON Exporter
Wants=network-online.target
After=network-online.target
[Service]
User=ubuntu
Type=simple
ExecStart=/usr/bin/python /home/ubuntu/monitor/platon-exporter.py 
[Install]
WantedBy=multi-user.target
2 个赞

还得是我dd哥牛逼

1 个赞

赶紧拉盘吧,实在无聊。

赶紧拉盘吧,实在无聊。

2023.6.28 更新

更新内容

  1. 增加 peerCount Gauge
#!/usr/bin/env python3
# -*- coding: UTF-8 -*-
'''
@Author  :dolphintwo
@Date    :2023/6/28 16:08 
@requirements:
pip install --no-cache-dir prometheus-client PyYAML requests web3 psutil
'''

import logging
import time
import os
import psutil
import sys
import requests
import traceback
from web3 import Web3, HTTPProvider
import prometheus_client
from prometheus_client import start_http_server
from prometheus_client.core import REGISTRY, GaugeMetricFamily

prometheus_client.REGISTRY.unregister(prometheus_client.GC_COLLECTOR)
prometheus_client.REGISTRY.unregister(prometheus_client.PLATFORM_COLLECTOR)
prometheus_client.REGISTRY.unregister(prometheus_client.PROCESS_COLLECTOR)

LOG_FORMAT = "%(asctime)s [%(levelname)s] %(message)s"
DATE_FORMAT = "%Y/%m/%d %H:%M:%S"
LOG_LEVEL = "INFO"

log = logging.getLogger(__name__)
logging.basicConfig(stream=sys.stdout, level=os.environ.get(
    "LOGLEVEL", LOG_LEVEL), format=LOG_FORMAT, datefmt=DATE_FORMAT)

# requests参数
connect_timeout = 10
read_timeout = 10
headers = {'content-type': "application/json"}
body = {"pageNo": 1, "pageSize": 300, "key": "", "queryStatus": "all"} # 分页设置
url = 'https://scan.platon.network/browser-server/staking/aliveStakingList' # 获取浏览器数据


def _settings():
    global settings

    settings = {
        'platon_exporter': {
            'interval': 60,
            # 'platon_rpc': "https://openapi2.platon.network/rpc", # 本地调试使用
            'platon_rpc': "http://127.0.0.1:6789",
            'enable_accounts': 'off', # 检测余额用
            'additional_accounts_list': [ # 格式为HEX地址+账户昵称,建议按照以下格式
                ["0x0F342c83ca270aAB0e526C98bCb18B89f685B101", "staking"],
                ["0x57E3d9412DB22CF45555654D4cB9c9539EFA1841", "reward"],
            ],
            'enable_nodes': 'off', # 监测节点信息用,多节点监测建议只在一台机器上集中监测,格式为nodeid数组
            'nodeid': [
                "0x9ca01d3332c2e4a7e16fa50c77a30bf7905aee1c0d7c456769b33c2939b3ee410a79a6fb204d826a5997b903964ff0fff62cf8f1c2a0b73b3bbc5f96c265ad49",
                "0xdfea630951d41e93a32abf8a9afd4de2a014b72512144a395fda0462f798f898f6f5a70f30b41b106bd73f33bd7408a8320df678ecfc9c6c7eb3ab0edf4a9859",
            ],
            'listen_port': 9189,
        },
    }


def _scanrequest():
    '''
    获取浏览器数据
    '''
    try:
        result = requests.post(url, json=body, headers=headers, timeout=(
            connect_timeout, read_timeout))

        if result.status_code == 200:
            result = result.json()
            return result

        else:
            logging.warning('status_code:{},msg:{}'.format(
                result.status_code, result.text))
            return 0

    except Exception:
        logging.warning(traceback.format_exc())
        return 0


def _scannodesinfo():
    '''
    获取节点信息
    '''
    result = _scanrequest()

    if result:
        validators_info = result['data']
        mynodes = (
            validator for validator in validators_info if validator['nodeId'] in settings['platon_exporter']['nodeid'])
        return mynodes

    else:
        logging.warning('Can not get scan_nodesinfo.')
        return 0


def find_procs_by_name(name):
    '''
    获取进程信息
    '''
    ls = []
    for p in psutil.process_iter(["name", "exe", "cmdline"]):
        if name == p.info['name'] or \
                p.info['exe'] and os.path.basename(p.info['exe']) == name or \
                p.info['cmdline'] and p.info['cmdline'][0] == name:
            ls.append(p)
    return ls


class PlatonCollector:
    def collect(self):
        metrics = {
            'platon_current_block': GaugeMetricFamily('platon_block_number', 'The number of the most recent block.', labels=['hostname']),
            'platon_gas_price_wei': GaugeMetricFamily('platon_gas_price_wei', 'The current gas price in Wei.', labels=['hostname']),
            'platon_syncing': GaugeMetricFamily('platon_syncing', 'Boolean syncing status.', labels=['hostname']),
            'chain_id': GaugeMetricFamily('platon_chain_id', 'The currently configured "Chain Id".', labels=['hostname']),
            'peer_count': GaugeMetricFamily('platon_peer_count', 'The number of peers currently connected to the client.', labels=['hostname']),

            'boot_time': GaugeMetricFamily('node_boot_time', 'System Boot time.', labels=['hostname']),
            'service_time': GaugeMetricFamily('node_service_time', 'Service Start time.', labels=['hostname']),
            'cpu_usage': GaugeMetricFamily('node_cpu_usage', 'System CPU usage in percent.', labels=['hostname']),
            'ram_usage': GaugeMetricFamily('node_ram_usage', 'System RAM usage in percent.', labels=['hostname']),
            'disk_usage': GaugeMetricFamily('node_disk_usage', 'System RAM usage in percent.', labels=['hostname']),

            # 节点排名
            'validator_node_ranking': GaugeMetricFamily('validator_node_ranking', 'Validator Node Rank.', labels=['hostname', 'nodename', 'version']),
            # 1候选2活跃3出块4在退5已退6共识
            'validator_node_status': GaugeMetricFamily('validator_node_status', 'Validator Node Status.', labels=['hostname', 'nodename', 'version']),
            # 总质押
            'validator_node_totalvalue': GaugeMetricFamily('validator_node_totalvalue', 'Validator Node Total Stakes (LAT).', labels=['hostname', 'nodename', 'version']),
            # 接受质押
            'validator_node_delegatevalue': GaugeMetricFamily('validator_node_delegatevalue', 'Validator Node Delegations (LAT)', labels=['hostname', 'nodename', 'version']),
            # 当前委托者数
            'validator_node_delegateqty': GaugeMetricFamily('validator_node_delegateqty', 'Validator Node Delegators.', labels=['hostname', 'nodename', 'version']),
            # 低出块处罚
            'validator_node_slashlowqty': GaugeMetricFamily('validator_node_slashlowqty', 'Validator Node low block rate slash.', labels=['hostname', 'nodename', 'version']),
            # 双签处罚
            'validator_node_slashmultiqty': GaugeMetricFamily('validator_node_slashmultiqty', 'Validator Node double signing slashing.', labels=['hostname', 'nodename', 'version']),
            # 累计出块
            'validator_node_blockqty': GaugeMetricFamily('validator_node_blockqty', 'Validator Node Blocks.', labels=['hostname', 'nodename', 'version']),
            # 预计节点年化率
            'validator_node_expectedincome': GaugeMetricFamily('validator_node_expectedincome', 'Validator Node Validator Yield.', labels=['hostname', 'nodename', 'version']),
            # 预计委托年化率
            'validator_node_deleannualizedrate': GaugeMetricFamily('validator_node_deleannualizedrate', 'Validator Node Delegated Yield.', labels=['hostname', 'nodename', 'version']),
            # 委托奖励比例
            'validator_node_delegatedrewardratio': GaugeMetricFamily('validator_node_delegatedrewardratio', 'Validator Node Delegated Reward Ratio.', labels=['hostname', 'nodename', 'version']),
            # 24小时出块率
            'validator_node_genblocksrate': GaugeMetricFamily('validator_node_genblocksrate', 'Validator Node 24H Gen-Blocks Rate.', labels=['hostname', 'nodename', 'version']),
        }

        # metric: service_time
        try:
            p = find_procs_by_name("platon")
            if len(p) == 1:
                createtime = p[0].create_time()
                metrics['service_time'].add_metric(
                    labels=[os.uname().nodename], value=createtime)
        except (
            requests.exceptions.ConnectionError,
            requests.exceptions.ReadTimeout
        ) as e:
            logging.warning(
                "Can't get process. The error received follows.")
            logging.warning(e)
        except ValueError as e:
            logging.warning(
                "Can't get the value for service_time. The error received follows.")
            logging.warning(e)

        # metric: boot_time
        try:
            metrics['boot_time'].add_metric(
                labels=[os.uname().nodename], value=psutil.boot_time())
        except (
            requests.exceptions.ConnectionError,
            requests.exceptions.ReadTimeout
        ) as e:
            logging.warning(
                "Can't get sysinfo. The error received follows.")
            logging.warning(e)
        except ValueError as e:
            logging.warning(
                "Can't get the value for boot_time. The error received follows.")
            logging.warning(e)

        # metric: cpu usage
        try:
            cpu_usage = psutil.cpu_percent()
            metrics['cpu_usage'].add_metric(
                labels=[os.uname().nodename], value=cpu_usage)
        except (
            requests.exceptions.ConnectionError,
            requests.exceptions.ReadTimeout
        ) as e:
            logging.warning(
                "Can't get sysinfo. The error received follows.")
            logging.warning(e)
        except ValueError as e:
            logging.warning(
                "Can't get the value for cpu_usage. The error received follows.")
            logging.warning(e)

        # metric: ram usage
        try:
            metrics['ram_usage'].add_metric(
                labels=[os.uname().nodename], value=psutil.virtual_memory()[2])
        except (
            requests.exceptions.ConnectionError,
            requests.exceptions.ReadTimeout
        ) as e:
            logging.warning(
                "Can't get sysinfo. The error received follows.")
            logging.warning(e)
        except ValueError as e:
            logging.warning(
                "Can't get the value for ram_usage. The error received follows.")
            logging.warning(e)

        # metric: disk usage
        try:
            metrics['disk_usage'].add_metric(
                labels=[os.uname().nodename], value=psutil.disk_usage(os.sep).percent)
        except (
            requests.exceptions.ConnectionError,
            requests.exceptions.ReadTimeout
        ) as e:
            logging.warning(
                "Can't get sysinfo. The error received follows.")
            logging.warning(e)
        except ValueError as e:
            logging.warning(
                "Can't get the value for disk_usage. The error received follows.")
            logging.warning(e)

        if settings['platon_exporter']['enable_nodes'] == 'on':
            mynodes = _scannodesinfo()

            for node in mynodes:

                # metric: validator_node_*
                try:
                    metrics['validator_node_ranking'].add_metric(value=node['ranking'], labels=[
                                                                 os.uname().nodename, node['nodeName'], node['version']])
                    metrics['validator_node_status'].add_metric(value=node['status'], labels=[
                                                                os.uname().nodename, node['nodeName'], node['version']])
                    metrics['validator_node_totalvalue'].add_metric(value=node['totalValue'], labels=[
                                                                    os.uname().nodename, node['nodeName'], node['version']])
                    metrics['validator_node_delegatevalue'].add_metric(value=node['delegateValue'], labels=[
                                                                       os.uname().nodename, node['nodeName'], node['version']])
                    metrics['validator_node_delegateqty'].add_metric(value=node['delegateQty'], labels=[
                                                                     os.uname().nodename, node['nodeName'], node['version']])
                    metrics['validator_node_slashlowqty'].add_metric(value=node['slashLowQty'], labels=[
                                                                     os.uname().nodename, node['nodeName'], node['version']])
                    metrics['validator_node_slashmultiqty'].add_metric(value=node['slashMultiQty'], labels=[
                                                                       os.uname().nodename, node['nodeName'], node['version']])
                    metrics['validator_node_blockqty'].add_metric(value=node['blockQty'], labels=[
                                                                  os.uname().nodename, node['nodeName'], node['version']])
                    metrics['validator_node_expectedincome'].add_metric(value=node['expectedIncome'], labels=[
                                                                        os.uname().nodename, node['nodeName'], node['version']])
                    metrics['validator_node_deleannualizedrate'].add_metric(value=node['deleAnnualizedRate'], labels=[
                                                                            os.uname().nodename, node['nodeName'], node['version']])
                    metrics['validator_node_delegatedrewardratio'].add_metric(value=float(
                        node['delegatedRewardRatio'].strip('%')), labels=[os.uname().nodename, node['nodeName'], node['version']])
                    metrics['validator_node_genblocksrate'].add_metric(value=float(node['genBlocksRate'].strip(
                        '%')), labels=[os.uname().nodename, node['nodeName'], node['version']])

                except (
                    requests.exceptions.ConnectionError,
                    requests.exceptions.ReadTimeout
                ) as e:
                    logging.warning(
                        "Can't connect get validator node info. The error received follows.")
                    logging.warning(e)

        if settings['platon_exporter']['enable_accounts'] == 'on':
            metrics.update({
                'account_balance': GaugeMetricFamily(
                    'platon_account_balance',
                    'Account Balance in PlatON Network.',
                    labels=['currency', 'address', 'account', 'type', 'hostname']
                ),
            })
        web3 = Web3(HTTPProvider(
            endpoint_uri=settings['platon_exporter']['platon_rpc'], request_kwargs={'timeout': 60}))

        if web3:
            if settings['platon_exporter']['enable_accounts'] == 'on':
                for additional_account in settings['platon_exporter']['additional_accounts_list']:

                    # metric: platon_account_balance
                    try:
                        metrics['account_balance'].add_metric(
                            labels=['LAT', additional_account[0], additional_account[1], 'platon', os.uname().nodename],
                            value=web3.from_wei(
                                web3.eth.get_balance(additional_account[0]), 'ether')
                        )
                    except (
                        requests.exceptions.ConnectionError,
                        requests.exceptions.ReadTimeout
                    ) as e:
                        logging.warning(
                            "Can't connect to platon. The error received follows.")
                        logging.warning(e)

            # metric: platon_current_block
            try:
                metrics['platon_current_block'].add_metric(
                    value=web3.eth.block_number, labels=[os.uname().nodename])
            except (
                requests.exceptions.ConnectionError,
                requests.exceptions.ReadTimeout
            ) as e:
                logging.warning(
                    "Can't connect to platon. The error received follows.")
                logging.warning(e)
                metrics['platon_current_block'].add_metric(value=0, labels=[os.uname().nodename])
            except ValueError as e:
                logging.warning(
                    "Can't get the value for platon_current_block. The error received follows.")
                logging.warning(e)
                metrics['platon_current_block'].add_metric(value=0, labels=[os.uname().nodename])

            # metric: platon_gas_price_wei
            try:
                metrics['platon_gas_price_wei'].add_metric(
                    value=web3.eth.gas_price, labels=[os.uname().nodename])
            except (
                requests.exceptions.ConnectionError,
                requests.exceptions.ReadTimeout
            ) as e:
                logging.warning(
                    "Can't connect to platon. The error received follows.")
                logging.warning(e)
            except ValueError as e:
                logging.warning(
                    "Can't get the value for platon_gas_price_wei. The error received follows.")
                logging.warning(e)

            # metric: platon_syncing
            try:
                if web3.eth.syncing:
                    metrics['platon_syncing'].add_metric(
                        value=1, labels=[os.uname().nodename])
                else:
                    metrics['platon_syncing'].add_metric(
                        value=0, labels=[os.uname().nodename])
            except (
                requests.exceptions.ConnectionError,
                requests.exceptions.ReadTimeout
            ) as e:
                logging.warning(
                    "Can't connect to platon. The error received follows.")
                logging.warning(e)
            except ValueError as e:
                logging.warning(
                    "Can't get the value for platon_syncing. The error received follows.")
                logging.warning(e)

            # metric: chain_id
            try:
                metrics['chain_id'].add_metric(
                    value=web3.eth.chain_id, labels=[os.uname().nodename])
            except (
                requests.exceptions.ConnectionError,
                requests.exceptions.ReadTimeout
            ) as e:
                logging.warning(
                    "Can't connect to platon. The error received follows.")
                logging.warning(e)
            except ValueError as e:
                logging.warning(
                    "Can't get the value for platon_chain_id. The error received follows.")
                logging.warning(e)

            # metric: peer_count
            try:
                metrics['peer_count'].add_metric(
                    value=web3.net.peer_count, labels=[os.uname().nodename])
            except (
                requests.exceptions.ConnectionError,
                requests.exceptions.ReadTimeout
            ) as e:
                logging.warning(
                    "Can't connect to platon. The error received follows.")
                logging.warning(e)
            except ValueError as e:
                logging.warning(
                    "Can't get the value for platon_peer_count. The error received follows.")
                logging.warning(e)

        web3 = None

        for m in metrics.values():
            yield m


def _collect_to_http():
    start_http_server(int(settings['platon_exporter']['listen_port']))
    logging.info('PlatON Exporter running on http://localhost:9189/metrics')
    while True:
        time.sleep(int(1))


if __name__ == '__main__':
    _settings()
    logging.debug('Loaded settings: {}'.format(settings))
    REGISTRY.register(PlatonCollector())
    _collect_to_http()

2 个赞

2023.8.11 更新

更新内容

  1. 宕机时高度设为0(原为不设定)
  2. prometheus rules文件分享

触发效果图:

groups:
- name: servers_status
  rules:
  - alert: 节点存活
    expr:  up{job="platon-exporter"} == 0
    for: 1m
    labels:
      level: critical
    annotations: 
      summary: "机器 {{ $labels.instance }} 挂了"
      description: "服务器{{$labels.instance}} 挂了 (当前值: {{ $value }})"
  - alert: CPU使用率告警
    expr: node_cpu_usage{job="platon-exporter"} > 80
    for: 1m
    labels:
      level: warning
    annotations:
      summary: "{{ $labels.hostname }} CPU负载告警 "
      description: "{{$labels.hostname}} CPU使用率超过90%(当前值: {{ $value }})"
  - alert:  内存使用率告警
    expr:  node_ram_usage{job="platon-exporter"} > 80
    labels:
      level: critical
    annotations:
      summary: "{{ $labels.hostname }} 可用内存不足告警"
      description: "{{$labels.hostname}} 内存使用率已达85% (当前值: {{ $value }})"
  - alert:  磁盘使用率告警
    expr: node_disk_usage{job="platon-exporter"} > 80
    labels:
      level: warning
    annotations:
      summary: "{{ $labels.hostname }} 磁盘使用率告警"
      description: "{{$labels.hostname}} 磁盘使用率已超过80% (当前值: {{ $value }})"
  - alert:  磁盘使用率告警
    expr: node_disk_usage{job="platon-exporter"} > 90
    labels:
      level: critical
    annotations:
      summary: "{{ $labels.hostname }} 磁盘使用率告警"
      description: "{{$labels.hostname}} 磁盘使用率已超过90% (当前值: {{ $value }})"

- name: platon_status
  rules:
  - alert: 高度增加告警
    expr: increase(platon_block_number{job="platon-exporter"}[1m]) < 10
    for: 1m
    labels:
      level: critical
    annotations:
      summary: "{{ $labels.hostname }} 区块高度未增加"
      description: "{{$labels.hostname}} 最近1分钟区块同步较少 (当前值: {{ $value }})"
  - alert: Peer数量不够告警
    expr: platon_peer_count{job="platon-exporter"} < 20
    for: 1m
    labels:
      level: warning
    annotations:
      summary: "{{ $labels.hostname }} Peer数低"
      description: "{{$labels.hostname}} Peer数量低 (当前值: {{ $value }})"

- name: validator_status
  rules:
  - alert: 验证人排名靠后提示
    expr: validator_node_ranking{job="platon-exporter"} > 150
    labels:
      level: warning
    annotations:
      summary: "{{ $labels.nodename }} 验证人排名靠后"
      description: "{{$labels.nodename}} 验证人排名在150之后 (当前值: {{ $value }})"
  - alert: 验证人排名靠后告警
    expr: validator_node_ranking{job="platon-exporter"} > 180
    labels:
      level: critical
    annotations:
      summary: "{{ $labels.nodename }} 验证人排名靠后"
      description: "{{$labels.nodename}} 验证人排名在180之后 (当前值: {{ $value }})"
  - alert: 验证人状态不对(退出中)
    expr: validator_node_status{job="platon-exporter"} == 4
    labels:
      level: critical
    annotations:
      summary: "{{ $labels.nodename }} 验证人退出中"
      description: "{{$labels.nodename}} 验证人退出中 (当前值: {{ $value }})"
  - alert: 验证人状态不对(候选中)
    expr: validator_node_status{job="platon-exporter"} == 1
    labels:
      level: warning
    annotations:
      summary: "{{ $labels.nodename }} 验证人候选中"
      description: "{{$labels.nodename}} 验证人候选中 (当前值: {{ $value }})"
  - alert: 验证人出块率低
    expr: validator_node_genblocksrate{job="platon-exporter"} < 95
    labels:
      level: warning
    annotations:
      summary: "{{ $labels.nodename }} 验证人出块率低"
      description: "{{$labels.nodename}} 验证人出块率低 (当前值: {{ $value }})"

赶紧归零吧,实在无聊。

1 个赞

感谢dd哥:rofl::rofl::rofl:

各位大佬dd哥监控到什么新东西吗?

阅,,,,,,,,,,,,,